DevPartner Java™ Edition: Improve the performance and scalability of enterprise applications and web services. Today’s web-enabled business applications combine a wide range of technologies that are prone to performance and scalability problems. DevPartner Java™ Edition helps developers resolve these problems quickly and proactively, so they stay focused on coding applications and services that deliver more value to your business. DevPartner Java™ Edition, a comprehensive code quality suite, boosts application development productivity by automating source code reviews, memory and performance profiling, unit test and design validation, and other time-consuming tasks. Developers around the world rely on DevPartner Java™ Edition to detect and diagnose software performance and scalability problems early in the development process and as costeffectively as possible.
Solve memory-related problems
When Java applications use objects inefficiently, application stability and scalability can erode significantly. Using real-time memory heap analysis and debugging, DevPartner’s memory analysis capabilities quickly zero in on elusive memory problems that otherwise could take hours or days to find. DevPartner helps developers:
- examine and optimize object utilization by automatically prioritizing memoryintensive methods and lines of code
- identify unused objects that are retained in memory for an extended time
- find memory leaks that can cause application instability or crashes
- reduce garbage collection overhead caused by excessive use of short-lived objects

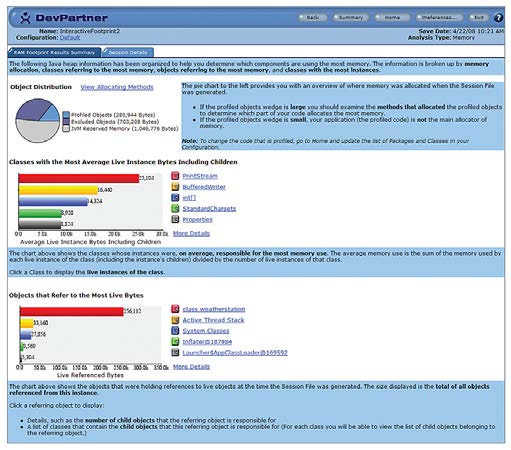
The DevPartner memory analysis feature identifies objects that consume the most memory, objects that are retained in memory too long, and short-lived objects that cause excessive garbage collection overhead.

The DevPartner performance analysis feature identifies and prioritizes CPU-intensive methods and lines-of-code, and also measures overall time spent executing code that waits on external resources such as database, network and file I/O.
Locate performance bottlenecks
The performance analysis capabilities of DevPartner pinpoint performance bottlenecks without altering the accuracy of the Java runtime environment. DevPartner features multiple views of performance data to help developers locate performance bottlenecks quickly and easily-right down to the line of code. Performance session data is presented in an intuitive, browser-based user interface in which developers can navigate and analyze timing data associated with source files, libraries, methods and individual lines of code. Performance snapshots display profiling data while an application is still running. Customizable data categories allow developers to identify performance trends for each module in a transaction. Many performance slowdowns occur when an enterprise Java application interacts with external technologies such as the database, mainframe, network and file system. DevPartner isolates these interactions and shows how they contribute to overall response time, allowing developers to:
- determine the best return on tuning efforts
- compare successive sessions by examining CPU and clock times
- track the call count for each method and the cumulative performance impact
- understand the relationship between methods and objects in the call graph
- measure how much time is spent on any application tier or API type
Automate code reviews
Source code peer reviews are a valuable mechanism for finding errors and ensuring compliance with coding standards and best practices. DevPartner’s code validation feature automates the code review process to raise code quality and save valuable development time. The automated code review process scans application source code to detect coding errors and ensure compliance with coding standards and best practices.
Validate application design
Poor design quality makes it tough to add new features without introducing unwanted side effects, and can result in higher maintenance costs. By analyzing a program’s source code, DevPartner creates a graphical application model that allows developers and architects to validate program implementation with the original design. This helps developers to visualize package and class dependencies using simple UML diagrams. Developers can visualize the application as a whole or drill down into particular areas of interest.
Using built-in design validation rules, DevPartner also can highlight violations and even suggest changes that would improve the structure of the system. Its unique capability to reconstruct an intended layering makes it an invaluable tool for discovering the architecture of an implementation that has lost touch with the original design.

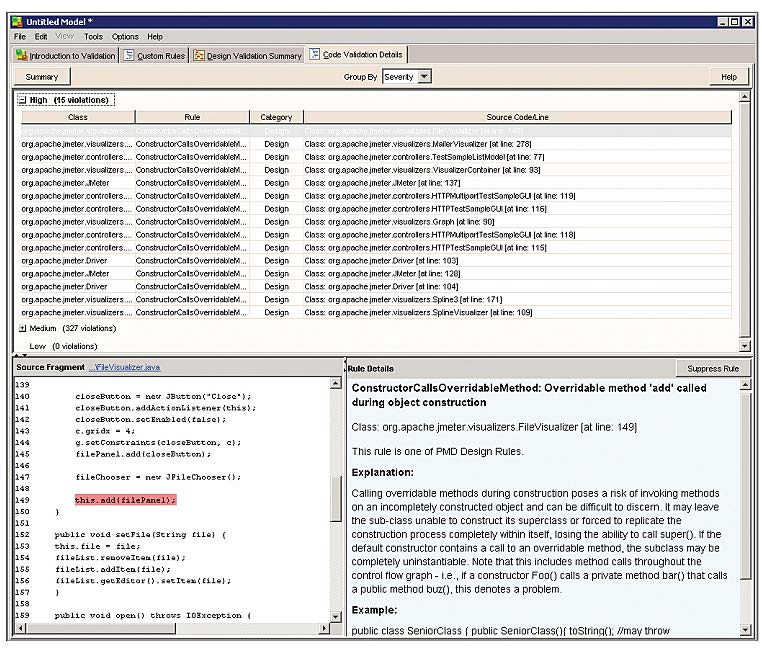
The DevPartner code validation feature reviews application source code to validate program design, detect coding errors, and ensure compliance with coding standards and best practices.

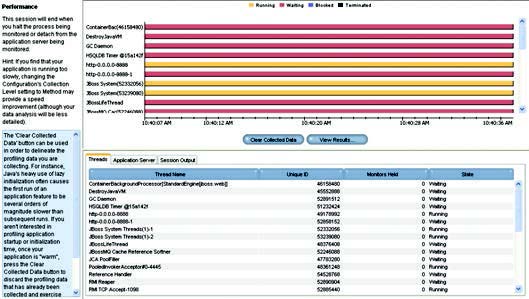
The DevPartner thread analysis feature offers live thread view and can detect actual and potential deadlocks in your application.
Unravel multi-threading problems
Thread deadlock is a common problem in multi-threaded applications. The thread analysis capabilities of DevPartner help developers locate client- and serverside thread deadlock problems during normal development and testing cycles. Developers get a live view of running threads, their state, history and number of monitors held. Thread ana lysis also provides insight into both actual and potential deadlocks. It automatically watches application execution paths and compares them against all possible call path combinations to determine if a deadlock might occur - something static debuggers are not designed to do.
Locate untested code
DevPartner’s coverage analysis capabilities automatically locate unexecuted code in applications and components throughout development and unit testing. DevPartner also measures code volatility by tracking code that has changed between builds. It gathers comprehensive coverage information during development, quickly and easily gathering statistics and data for applications, components, classes, methods and individual lines of code.
DevPartner coverage analysis increases code quality by enabling developers and testers to:
validate test suite coverage by collecting data across multiple tiers and systems focus on fixing and retesting modified portions of code measure and track test coverage and code volatility over time
